
PCSoft Analytics

Business Analytics With AI, Built on Your ERP Data

Connect your IEV ERP and SQL data sources, build interactive reports and dashboards, and ask questions in plain English. Get answers backed by trust scores and evidence, without setting up a separate data warehouse.

Connects with
  • IEV ERP
  • SQL Server
  • PostgreSQL
  • MySQL
  • Oracle
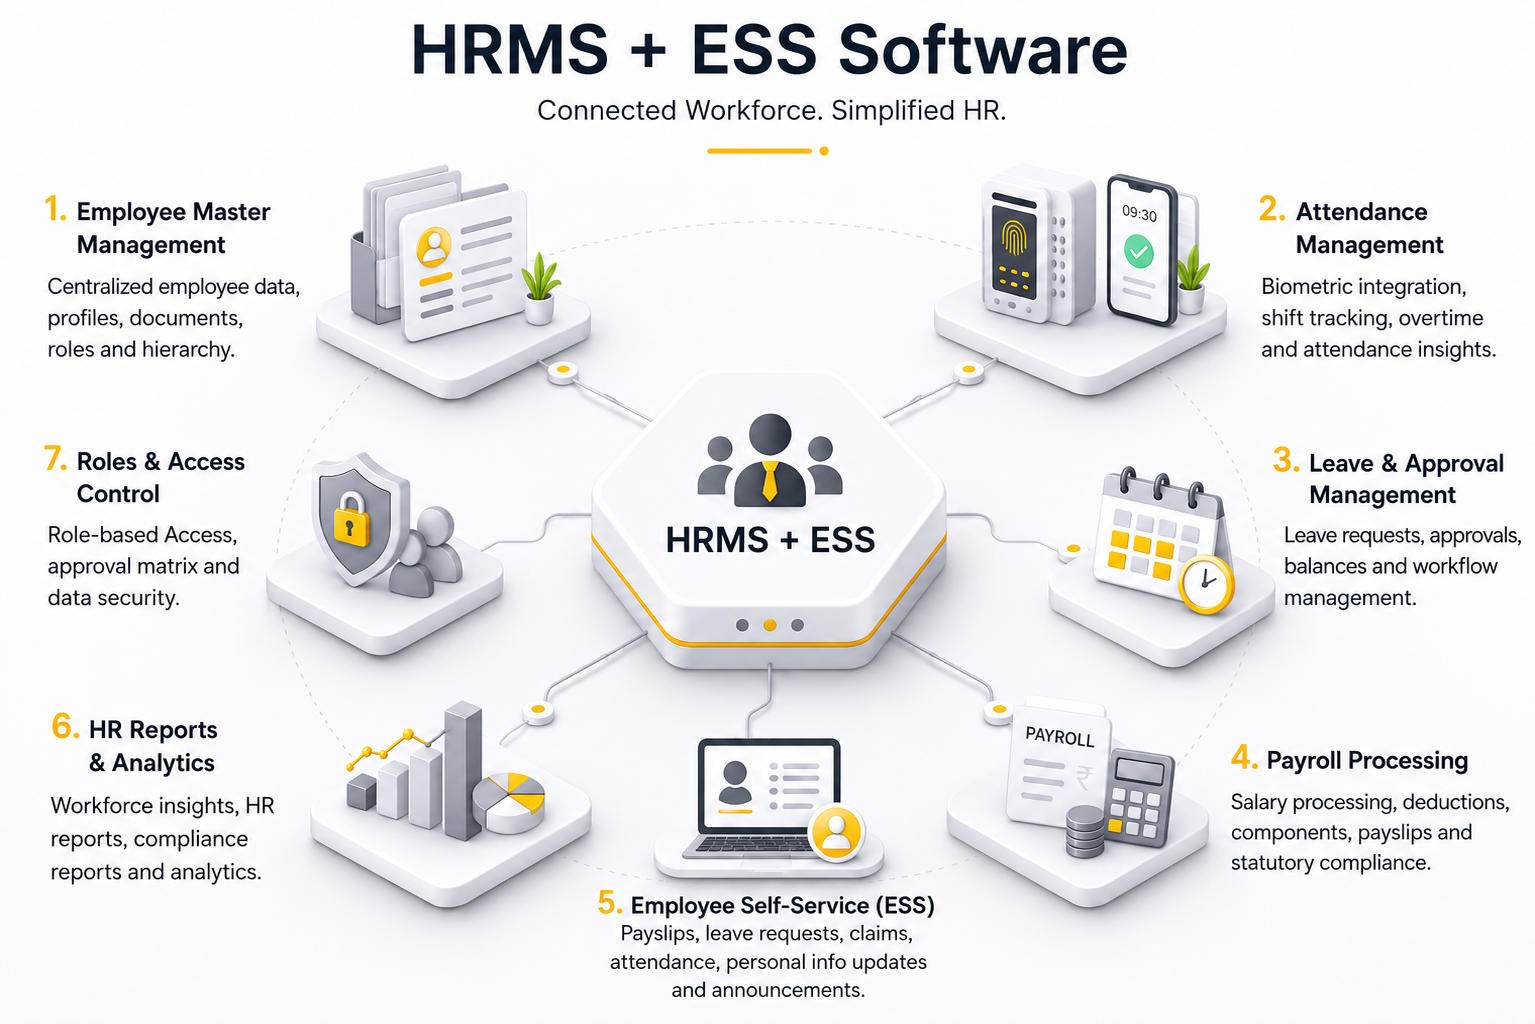
IEV HRMS + ESS

Everything Your HR Team Runs, in One Place.

Manage employee data, biometric attendance, payroll, leave, approvals, and self-service in one connected system. Built inside PCSOFT’s ERP, so HR data flows directly into finance, costing, and reporting, no exports, no reconciliation, no duplicate entries between systems. Whether you’re running one plant or fifteen, one shift or three, IEV HRMS + ESS handles the full workforce lifecycle without HR teams stitching data together across tools.

PCSoft Analytics

Centralised Business Reporting and Analytics

Your business generates a huge amount of data every day. But finding the right information often means going through several reports, checking Excel sheets or asking different departments for updates. PCSOFT Analytics makes that work easier. It connects to your existing ERP data and helps you turn it into useful reports, dashboards and answers. You can even ask questions in plain English and see the information behind each answer.

  • Works on your existing ERP data
  • Reports, dashboards and answers in one place
  • Ask in plain English, see the data behind it
PCSoft Analytics

Comprehensive ERP Data Analytics Platform

Unified Data Integration

Bring information from your IEV ERP and other connected databases into one place. Work with data from accounts, purchases, inventory, production and sales without constantly switching between reports or maintaining separate copies of the same information.

Custom Reporting and Visualisation

Create reports, charts and dashboards around the numbers that matter to your business. Compare results, identify changes and explore detailed information without starting from scratch whenever a new report is required.

Analytics Expert

AI-Powered Business Intelligence

Use Analytics Expert to ask business questions in plain English. Receive relevant tables, charts and supporting SQL, along with a trust score and evidence that helps your team verify the results before making decisions.

Capabilities

Advanced Reporting and Analytics Capabilities

01 / 06

Multi-Source Database Connectivity

Your information may be stored in different databases, but you shouldn't have to work with each one separately. PCSOFT Analytics connects with IEV ERP and supports commonly used databases, including SQL Server, PostgreSQL, MySQL and Oracle. Data can be updated automatically or whenever needed. You can also check when each source was last updated, so you know how current your reports are.

  • IEV ERP
  • SQL Server
  • PostgreSQL
  • MySQL
  • Oracle
02 / 06

Visual Data Modeling and Dataset Management

Different reports often need information from different tables. PCSOFT Analytics makes it easier to bring that information together. You can connect tables visually, write your own queries when needed and preview the results as you work. Once you've prepared the data, you can use it in multiple reports and dashboards instead of repeating the same work every time.

  • Visual table joins
  • Custom queries
  • Live preview
  • Reusable datasets
03 / 06

Custom MIS Reporting and Multidimensional Analysis

Not every question can be answered with a standard report. Some need a quick summary, while others require detailed figures, comparisons or a closer look at individual records. PCSOFT Analytics lets you create different report formats, add calculations, apply filters and organise information as required. Whether it's a monthly management review or a specific business query, you can build a report around the information you need.

  • Report formats
  • Calculations
  • Filters
  • Drill-down to records
04 / 06

Interactive KPI Dashboards and Data Visualisation

A dashboard should tell you more than whether a number has gone up or down. With PCSOFT Analytics, you can track important figures, compare trends and look more closely at changes that need attention. Choose from 13 types of charts, arrange information to suit your requirements and bring related reports together. You can also use statistical charts to identify unusual changes that might otherwise be missed.

  • 13 chart types
  • Trend comparison
  • Statistical charts
05 / 06

Natural Language Analytics and AI-Assisted Insights

Analytics Expert lets you ask questions such as "Which stock items are tying up the most working capital?" and receive answers presented through tables and charts. Each answer includes a trust score, supporting SQL and evidence, so you can see where the information comes from. The system also provides suggested follow-up questions and keeps a searchable history of earlier analyses.

Ask Analytics Expert Which stock items are tying up the most working capital?
  • Trust score
  • Supporting SQL
  • Evidence
  • Follow-up questions
  • Searchable history
06 / 06

Role-Based Access Control and Reporting Automation

Different people need access to different information. PCSOFT Analytics lets you decide who can view, edit or share reports and dashboards. You can also schedule reports to be sent regularly, rather than preparing them manually every time. Automatic alerts notify administrators if a data update fails or something changes in a connected database, helping your team identify reporting issues before they go unnoticed.

  • View / edit / share rights
  • Scheduled reports
  • Failure alerts
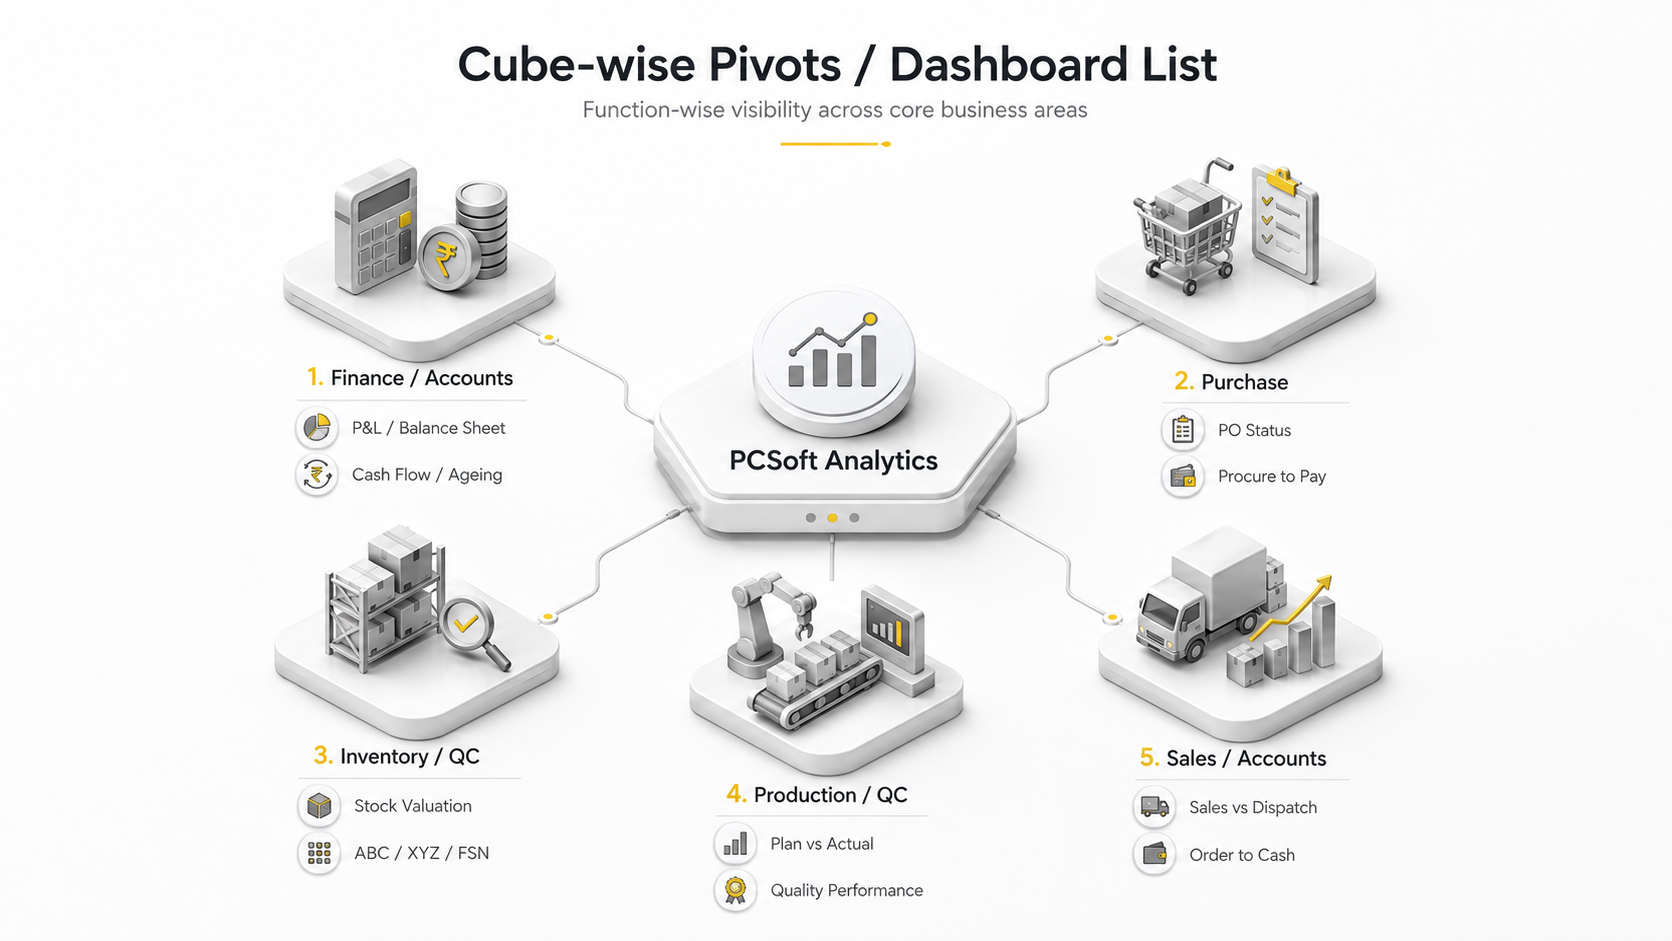
For every team

Department-Wise Business Analytics

Executive and Management Analytics

Get an overview of business performance without going through multiple departmental reports. Monitor important figures, understand changes and find answers to specific questions whenever you need them.

Financial Reporting and Analysis

Prepare financial reports, compare figures and analyse profitability or working capital using your existing business data. Spend less time putting reports together and more time understanding what the numbers mean.

Production and Operations Analytics

Keep track of production, inventory, purchases and other operational information. Compare results, identify changes and get a clearer view of the activities that affect daily operations.

Sales Performance Analytics

Understand sales performance across products, customers and periods. Review trends, compare results and find the information needed for sales planning and performance discussions.

Integrated Analytics for Smarter Business Decisions

See how PCSOFT Analytics can help your team simplify reporting, create interactive dashboards and analyse business data using AI. Schedule a product demonstration to explore its capabilities.